Tuesday 29 September 2015

Jupiter Weather Report: 2014/15 Apparition

In an earlier post, I described how the army of citizen scientists provide near-continuous updates on Jupiter's atmospheric phenomena, allowing the British Astronomical Association and others to provide regular digests on jovian weather and reasonable forecasts of what might be coming.  At the time of writing (September 2015) Jupiter is a few weeks past solar conjunction and ready to make it's reappearance in our dawn skies, so the 2014/15 apparition that was centred on the February 6th opposition (when Jupiter was at its biggest and brightest) is now over.  Scientists all over the world are preparing observing proposals for the next 2015/16 apparition on Earth-based observatories, which will be the final opportunity to characterise Jupiter's churning weather before the arrival of the Juno spacecraft on July 4th 2016.  For details of the nomenclature of Jupiter's belts and zones, please refer to my previous post.

From the amateur community, the first images of the apparition were uploaded to PVOL on August 31st 2014, and the last ones on July 31st 2015.  I'm indebted to Marco Vedovato of the Italian Amateur Astronomers Planet Section for using the WinJUPOS software tool to create global maps of Jupiter regularly during the apparition - his index of maps can be found here.   Further insights into Jupiter's complex goings-on have been provided by the wonderful Hubble Space Telescope's OPAL (Outer Planet Atmospheres Legacy) project, led by Amy Simon, Mike Wong and Glenn Orton. Hubble observations of Jupiter on January 19th 2015 are available here, and a new '4K movie' released by HST can be seen below.

Jupiter as observed on January 19th 2015 by the Hubble Space Telescope WFC3 instrument.  The findings of the new dataset are described by Simon et al., 2015, ApJ, 812, 55

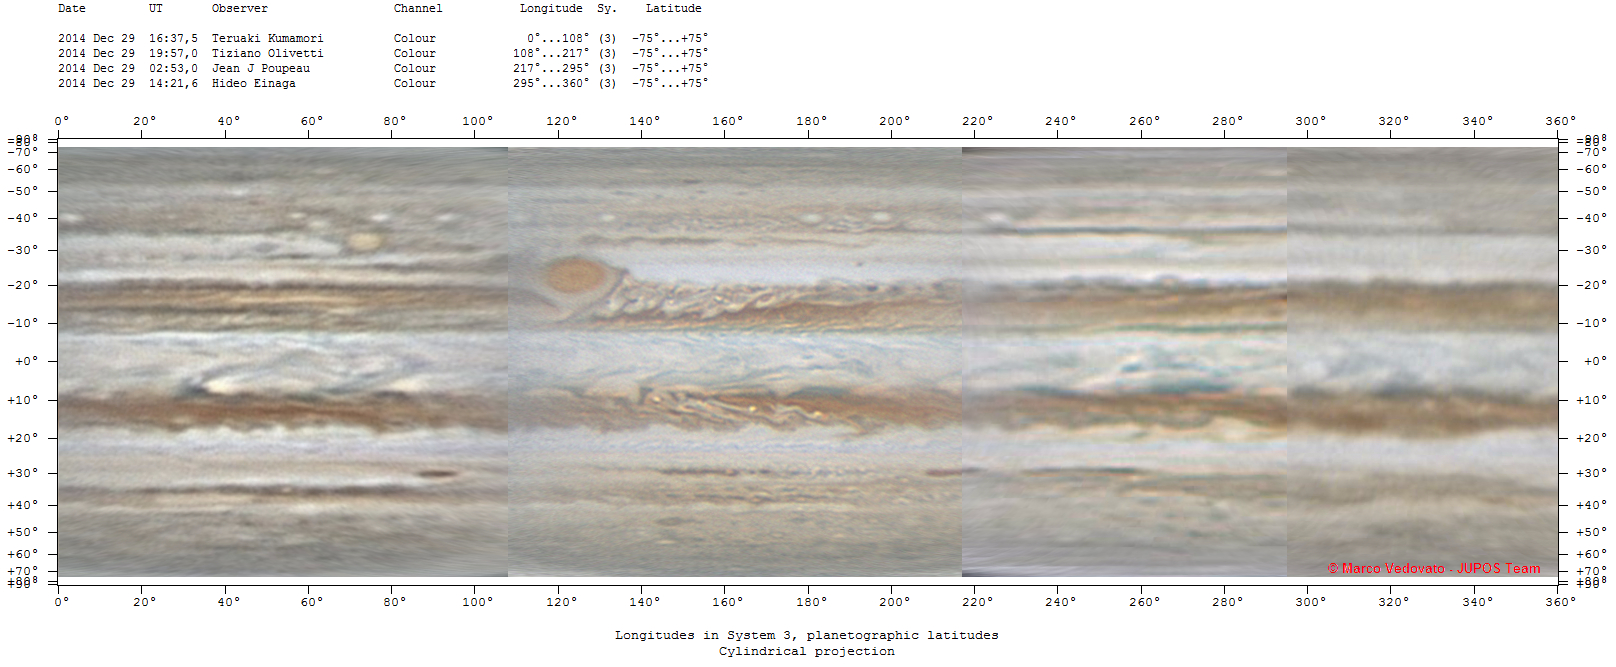
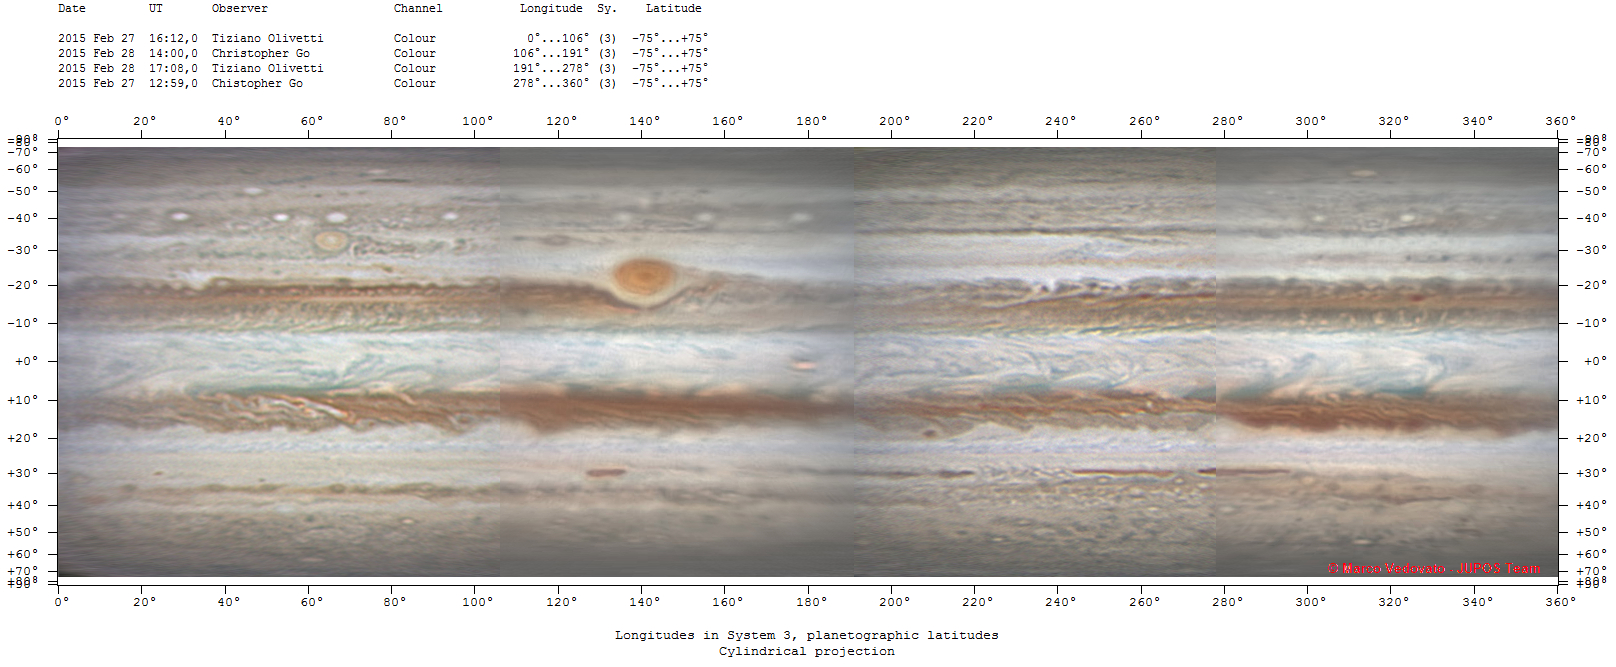
Below I've provided links to some of Vedovato's JUPOS maps for various points during this apparition - they prefer having north to the bottom of the images as this is how Jupiter would really be seen through the eyepiece.  The following four images were taken between October 2014 and April 2015, and you can see the evolution of features by toggling between them (all should be credited to Marco Vedovato and the JUPOS team).


South Tropical Domain:  GRS Shrinkage has Slowed?

Jupiter's Great Red Spot, sat between the SEB and STropZ, has been steadily shrinking in east-west extent for many years (we've known this for a while, despite recent news reporting!).  A couple of years ago the community discovered that this shrinkage had gone through an unprecedented acceleration, with measurements by citizen scientists suggesting a longitudinal width of 13.6±0.7 degrees in 2013/14, down from 15.3±0.8 degrees in 2011/12.  In 2014/15 this longitudinal shrinkage seems to have stopped or slowed down, with the size being the same as last year - approximately 13.8±0.9 degrees longitude according to measurements by the JUPOS team (Vedovato et al. - see his charts here).  M. Jacquesson was able to use November 2014 images to measure the internal rotation of the GRS at approximately 3.8 days, consistent with values measured in the 2013/14 apparition.

Observations from the Hubble Space Telescope (Simon et al., 2015) captured some wonderful spiralling filamentary structure within the GRS core, and indicated that the core of the GRS remains just as orangey-red as it did in the previous 2013/14 apparition, consistent with the general appearance in the amateur imaging.  It has narrowed in latitudinal (north-south) extent too, implying a less severe interaction with the SEBs retrograde jet that flows around its northern periphery.

As for the rest of the South Equatorial Belt (SEB), it appears to be business as usual - lots of complex rifting in the turbulent wake to the northwest of the Great Red Spot, and no sign of any 'fading activity' such as that last witnessed in 2009/10, when the entire SEB whitened over.  It's really hard to predict these SEB whitening cycles, so who knows when the next might begin!

North Tropical Domain:  Waiting for an NEB Expansion:

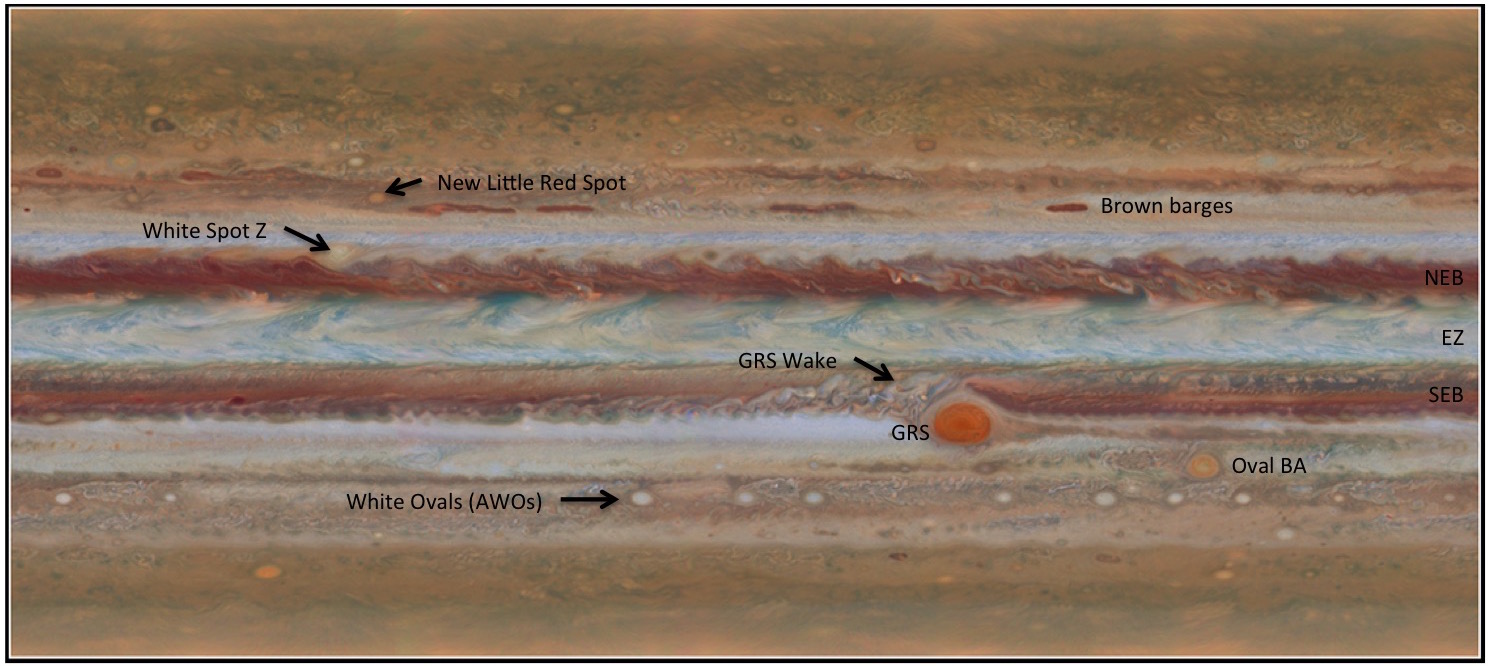
North Equatorial Belt (NEB):  The width of this dark-red belt changes over time, having shrunk during 2013 with the disappearance of the dark, distinct brown barges on its northern edge.  At the end of the 2014/15 apparition it may be on the verge of expanding again (the last such event took place in 2012), meaning that those brown barges could reappear during the next apparition.  NEB broadening events have been occurring at 3-5 year intervals since 1988, so we might expect another in the next couple of years - observers will be waiting to see if such a dramatic change in the belt/zone structure happens next year.  One of the most conspicuous features is 'White Spot Z', a white oval right on the ragged northern edge of the NEB (near 17N) that had a more reddish tinge last apparition.  This white spot can also be seen in the Hubble imaging.

The OPAL images in January 2015 captured some fine-scale waves within the NEB near 16N, a type of structure known as a baroclinic wave, not seen in Jupiter imaging since the Voyager days.  This fine wave was superimposed on top of other NEB cloud features, including a chain of cyclones at the same latitude and whiter anticyclones on the northern edge of the NEB (the retrograde jet called the NEBn).

North Temperate Domain:  Brown Barges:

The Northern Temperate Domain last underwent an upheaval back in 2012, and the cloud structures in this region still appear complex 3 years on.  In particular, there are several cyclonic 'Brown Barges' on the North Temperate Belt (NTB) near 30N:  4-5 brown barges are now evident within the NTB and are extremely elongated in east-west extent.  John Rogers suggests that rifting during the previous apparition generated an extremely dark spot in the Northern Temperate Zone (NTZ), which lengthened to become a dark streak that somehow evolved into the extremely long barge that we see today.

In general though, there were no signs of large NTB outbreaks (plumes on the jets), which occur at approximately 5-year intervals - the next one is likely to occur in 2016 or 2017, right smack bang in the middle of the Juno mission.  The NTB might have been showing signs of fading, as it does just before an outbreak, but when Jupiter disappeared from view the NTB was still unchanged...

The amateur community caught the birth of a new Little Red Spot in December 2014, just to the north (32N) of the brown barges.  It can be seen in the Hubble imaging, below.  It started as a white spot interacting with other ovals (that didn't survive), becoming larger and fawn-coloured, before appearing brighter and redder in January 2015.

Annotated version of Hubble imaging in January 2015, showing structures at all latitudes, including the brown barges of the North Temperate Domain and the newly-emerged Little Red Spot just to the north.  Credit:  NASA/ESA/Simon/Wong/Orton
South Temperate Domain:  Spots!

Oval BA continues it's slow eastward traversal of the temperate region, with a slightly weaker red colour than the previous apparitions (could the chemistry responsible for its reddening somehow be weakening, or the materials aging?).  BA passed the GRS again in the October 2014 (BA moving east, the GRS moving west), an event which happens every couple of years.  This close passage generated lots of chaotic structure in the STropZ that's sandwiched between BA and the GRS, providing insights into how these two giant anticyclones interact with one another. Intriguingly, a faint bluish region currently exists in the South Temperate Belt (STB) known as the STB Ghost - this cyclonic structure interacts with any spots that impinge upon them, but it's importance for the dynamics of the STB is still being explored.  The structured segments of the South Temperate Domain were subject of a detailed report by Rogers et al. that can be found here.

Even further south, the South South Temperature Belt (SSTB) is home to lots of anticyclonic white ovals (AWOs) - they can be clearly seen in the amateur imaging against the darker background, with more than ten of them moving towards the east over time.

Summary:

The 2014/15 apparition was largely business as usual for Jupiter, with the birth and death of new small red spots; chaotic activity in the equatorial belts and numerous white ovals in the south.   The GRS shrinkage may have slowed for now, and the brown barges in the North Temperate Domain are longer than we've seen in a long time, but the really exciting changes might still be to come in the next apparition.  In his three-year forecast for Jupiter, John Rogers suggests that we're waiting for both an outbreak of plumes on the North Temperate Belt jetstream and an expansion event for the North Equatorial Belt for the first time since 2012 - who knows what we'll find when Jupiter reappears for the first 'Juno apparition' of 2015/16.


Tuesday 15 September 2015

Towards a Jupiter Weather Forecast

Trying to keep track of the ever-changing face of Jupiter is a pretty big challenge, given that it is prone to unexpected outbursts of spots, plumes and weird meteorological activity, in addition to large-scale variations between the ever-present belts and zones.  Far from having a static and unchanging appearance, Jupiter is a dynamic world that can fascinate and surprise every time we turn our telescopes towards it.

Researchers here on planet 3 have only just begun to investigate the enormous forces and energy shaping the colourful bands that we see, and for some of us (cough cough) it's a life-long process of trying to understand what's going on deep within planet number 5.  For that ambitious goal, we'll need to throw our whole arsenal of atmospheric science at the problem - cloud microphysics and haze formation; thermochemistry, photochemistry and ion chemistry; meteorology, dynamics and circulation; and many other strands of natural science.  These are all diverse pieces of a puzzle that, when assembled into a whole, will allow us to understand the changing face of Jupiter, with implications for how atmospheres 'work' throughout our solar system.

But the starting point is an account of the phenomenology, looking for patterns and trying to explain how what we observe (changing colours and discrete spots, waves and bands) is related to the shifting environmental conditions and deep atmospheric flows.  Amateur observers, or citizen scientists, have amassed a truly incredible amount of data, an observational record that now spans many decades.  As astronomy opens up further, and the use of WebCam technology to capture 'lucky images' through our turbulent atmosphere becomes more mature, we're faced with a mountain of observational data to parse through.

Thankfully, there are dedicated teams out there doing just that, and keeping we "professionals" updated with what's changing on Jupiter (I use the term "professionals" lightly, meaning the few of us getting paid to do our hobby).  The problem is that the data is scattered far and wide, and it's not very easy to stay 'current' on what's going on.  I'm going to try to keep track of Jupiter's changing weather on this blog, and I'm basically summarising the enormous efforts of the British Astronomical Association's Jupiter Section, headed by my friend and colleague Dr. John Rogers.  John works closely with the JUPOS Project, a great team of software developers and astronomers who keep track of jovian features at regular intervals, measuring winds and identifying new phenomena within Jupiter's atmosphere.

Nomenclature for discussing jovian weather, from the BAA Jupiter Section (redrawn from John Roger's excellent book: Rogers JH, 'The Giant Planet Jupiter', Cambridge University Press, 1995).
The diagram above provides the necessary starting point for discussing Jupiter's ever changing weather.  Jupiter's powerful jet streams whip east and west in the troposphere - prograding jets (i.e., going with the direction of planetary rotation) go from west to east (westerlies), retrograding jets (i.e., going against the planet's rotation) go from east to west (easterlies).  These jets separate the coloured bands, and instabilities on the jets can excite waves, storms and vortices.  The forces powering these jets is still a subject of debate, but they have been shown to be reasonably constant over time.  Indeed, it's excursions from the norm that get people excited (amateurs and professionals alike).

Zones are typically brighter than belts, which have a red-brown appearance.  The colour differences are possibly (but not definitely) related to upwelling in zones and subsidence in belts).  The names of the most prominent features are shown in the diagram on the left, and moving from equator to pole they become more and more obscure.  But they form the framework in which Jupiter's climate can be discussed.   In future blog posts, I'll try to subdivide these as follows:

1.  Tropical Domain:  Comprises the equatorial zone (EZ) between two fast-moving prograde jets at 7N (NEBs jet) and 7S (SEBn jet); the North Equatorial Belt (NEB) from 7N to the retrograding jet at 18N (NEBn jet); and the South Equatorial Belt (SEB) from 7S to the fastest retrograding jet on the planet, the SEBs jet at 20S.  Poleward of the SEB and the NEB are two further zones, the South Tropical Zone (STropZ) and North Tropical Zone (NTropZ) that go up to prograde jets at 25N and 27S.  These mid-20s jets define the edges of the tropical domain.  Jupiter's Great Red Spot (GRS) sits within this domain, impinging on both the SEB and the STrZ and disrupting the flow of the retrograding jet at 20S (the SEBs jet).  Note that there are some more ephemeral features here too, like a reddish equatorial belt (EB) and a whitish SEB zone (SEBZ) that form every once in a while (right hand side of the left figure in the diagram).

2.  Temperate Domain:  Zones and belts become more closely packed as we move to higher and higher latitudes beyond the mid-20s.  The darker belts are characterised by prograde jets at the equatorward edge and retrograding jets at their poleward edge.  In the southern hemisphere we have the South Temperate Belt (STB), Southern Temperate Zone (STZ), then a series of further belts known as SSTB, SSTB, S3TB, etc.  The north follows suit with the NTB, NTZ, NNTB, NNTZ, etc.  Things get more and more complex, and in practise we find notable spots (e.g., newly forming red spots or white ovals) or outbreaks within these narrow bands.  For example, Oval BA sits within the South Temperate Belt.

3.  Polar Domain:  The organised patterns of the belts and zones finally give way to turbulent structures in the northern and southern polar regions (NPR and SPR), where high hazes and small-scale chaotic structures appear to dominate, bounded by prograde jets that exhibit waves.  The polar regions are the hardest to view from Earth so you won't hear much about their meteorology (until Juno provides us with a better view in 2016-17).

With this organisation in place, we can begin to discuss what's going on in each region, summarising the Herculean efforts of the amateur community to record these details.  It's then up to the atmospheric scientists to try to explain what's being recorded - and we're by no means there yet.  But in the next few years, with these expanding climatological databases, a Jupiter weather forecast might just be within our grasp.

Zonal windspeeds measured by both Voyager and Cassini, showing the relationship between the banded structure and the prograde and retrograde jet streams.