In May 2014 I was invited to give a talk at the Fermor Comparative Planetology meeting at the Royal Geological Society, a two-day event in London with a primary focus on terrestrial worlds but with some small component of atmospheric science. This blog post is a summary of that presentation, helping me to organise my thoughts and ideas before standing up in front of that audience!
The four giant planets of our Solar System are our closest examples of a class of astrophysical object that now appears commonplace in our galaxy. Their formation and orbital evolution shaped the planetary system we see around us today; each world is accompanied by a diverse collection of rings and satellites that may host habitable conditions; and their enormous atmospheres serve as planetary-scale laboratories for the physical and chemical phenomena governing the general properties of atmospheres and oceans. Comparative planetology of the four giants therefore provides an extreme test of our understanding of atmospheric processes under a range of different climatological and environmental conditions.
How to Build a Giant Planet?
 |
| Processes influencing the spectrum of a giant planet, from the cool jovians to the hottest exo-Jupiters (Fletcher et al., 2014) |
So what shapes the climate of a giant planet, and how do these environmental conditions relate to their visible properties? Despite the visible differences in zonal banding, weather activity, cloud colours and chemistry, the four giants exist on a continuum that ranges from the hydrogen-rich, highly irradiated hot Jupiters (2500 K) to the cool jovians of our own solar system (100 K). The emerging spectrum that we measure from a giant planet is approximately shaped by five inter-related factors: (i) the balance of elements and isotopes in the source reservoirs from which the planets formed; (ii) the atmospheric temperature structure that governs the thermochemical stability of these materials (e.g., methane or CO, ammonia or N2, etc.); (iii) the influence of the parent star providing the energy for meteorology and atmospheric photochemistry; (iv) atmospheric mixing of materials from the deepest to the highest layers; and (v) the condensation of volatiles into discrete cloud decks. The latter process is highly temperature dependent - as we warm the atmosphere from the coldest Neptune to the hottest Jupiter, we evaporate clouds to release the gases back into the vapour phase. So on the hottest Jupiters, clouds of ceramics, irons and silicates will exist, intermediate Jupiters might have clouds of water vapour at the top of the atmosphere (this might have been what Jupiter was like in the early days after its formation), and our present-day gas giants have clouds of ammonia ice. For our solar system, this condensate sequence, although simplified, explains why key volatiles like ammonia and water are locked away beneath condensation clouds in the deeper troposphere. On the cold ice giants, even methane can condense to form the topmost clouds.
The details of the chemistry depend on the balance of elements imprinted at the time of planet accretion, which provides the source materials for the reducing atmosphere. Observations have shown that all the giant planets are enriched in composition over protosolar abundances, suggesting accretion of rock-ice material along with the collapsing hydrogen-helium envelope as the giant planets formed. By measuring the abundances of several key species (hydrogen, carbon, oxygen, nitrogen, sulphur, etc.), we gain a window onto the processes at work during this planetary accretion. Deuterium and carbon enrichments suggest that the planets fall into two categories - the gas giants having 0.2-0.5% carbon and a D/H of 2e-5; the ice giants having 3-4% carbon and D/H of 4e-5. Note that there is no way to discriminate between Uranus and Neptune on compositional grounds, as was previously thought. Constraints from other species (e.g., the volatiles NH3, H2S and H2O) are much harder to measure because they are locked away beneath the deep condensation clouds. In a recent paper, we used ground-based infrared observations to show that the 15N/14N ratio on Jupiter and Saturn were indistinguishable, suggesting that 15N-enriched ammonia ices could not have been a major contributor to either planet, and they instead acquired their nitrogen by accretion of N2, potentially from the gas phase rather than accretion of solids. H2S and H2O are even harder, and we hope that NASA’s Juno mission might help constrain Jupiter’s bulk oxygen enrichment. Failing that, we need comparative in situ probing of each of these worlds to make further progress.
The Anatomy of a Giant
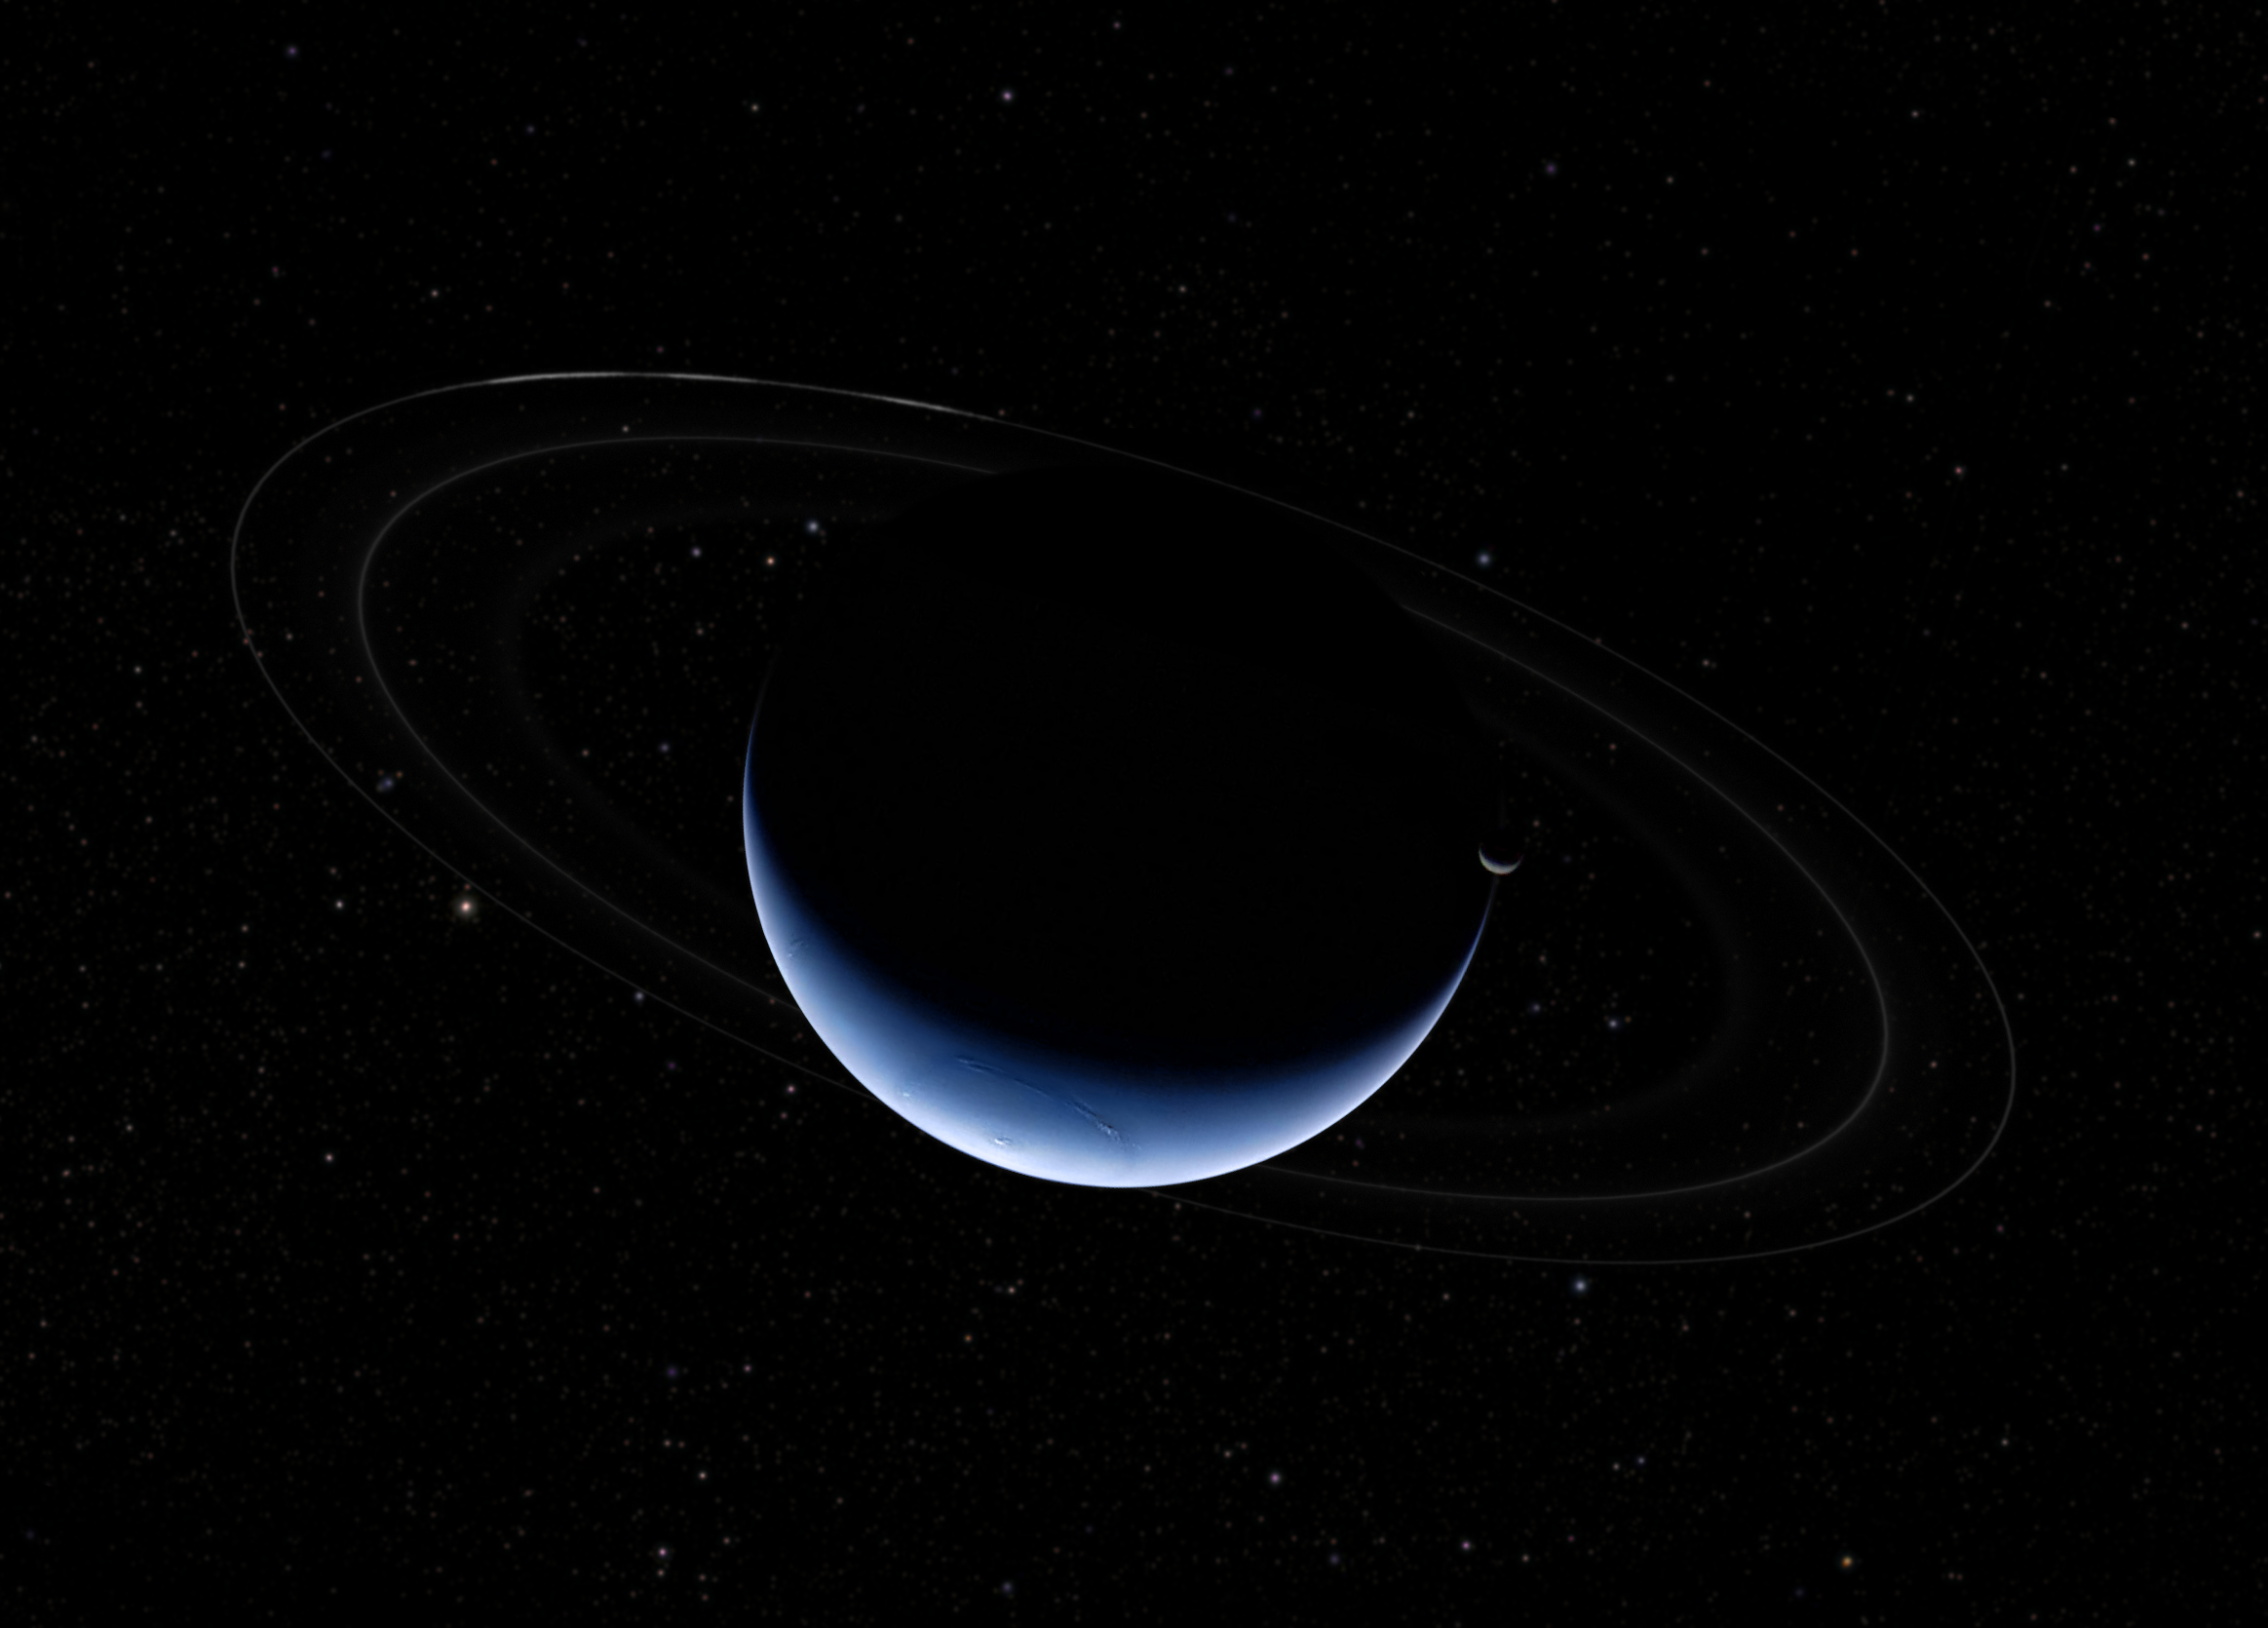
Each of the giant planets features a banded structure, with powerful eastward and westward jets separating belts and zones of differing thermal and chemical properties. Those jets are subject to spontaneous instabilities and can meander (such as Saturn’s hexagonal polar jet), exhibit wave activity (e.g., Jupiter’s northern equatorial hotspots) and spawn eddies and vortices. This horizontal organisation varies from planet to planet – the ice giants feature broad, retrograde equatorial jets; whereas the gas giants feature strong prograde jets with multiple extra-tropical jets. The circulation regimes appear to vary dramatically as we move from the stratosphere (wave-dominated and radiatively-cooled) to the deeper troposphere (convective overturning, lightning and eddy-driven winds and storms). The banded structures themselves are subject to global-scale variability (such as the recent fade and revival of Jupiter's South Equatorial Belt and storm eruptions on Saturn) that reveals insights into the deep processes powering and maintaining the planet’s appearance. Vortices vary in size and longevity, from Jupiter’s long-lived Great Red Spot to the sporadic dark ovals (and associated white orographic clouds) of the ice giants. Superimposed on these regional features are seasonal asymmetries of temperature, clouds and composition driven by insolation changes, varying from the negligible seasonal influence of Jupiter, to the Earth-like axial tilts of Saturn and Neptune (and associated polar vortices) and the extreme obliquity of Uranus (98o).
 |
| The anatomy of a giant planet from the equator to the poles. |
As we move from the equator to the extratropical bands and towards the poles, we transition from a horizontally-organised atmosphere to small-scale turbulence at the highest latitudes. The poles of the giants have a more mottled appearance, and are the apex of a planet-wide circulation system and the site of a unique connection between the neutral atmosphere and the charged magnetospheric environment. Jupiter’s poles have never been directly imaged as the majority of previous missions flew past or orbited in the equatorial plane, so we await Juno’s exploration to provide our first glimpses of the highest latitudes. Conversely, Saturn’s seasonal poles have been scrutinised for a decade by Cassini, revealing season stratospheric vortices, long-lived polar cyclones at both poles (hot cyclones related to hurricane-like eyewalls), and a strange hexagonal wave. Uranus’ poles feature seasonally-variable aerosol ‘hoods’ and have been revealed in depth by recent high-contrast ground-based imaging from Keck. Neptune’s warm polar vortex was recently shown to have developed since the Voyager encounter in 1989, but also features small-scale clouds right at the pole. A recently processed Voyager observation by Rolf Olsen has suggested the existence of a hexagonal wave at Neptune’s south pole, but this needs detailed scrutiny as it appears transient, differing from image to image. Nevertheless, it shows that the solar system still holds many surprises!
 |
| Possible evidence of a hexagonal wave on Neptune (Rolf Olsen) |
Explaining those Stripes
The primary effect of an atmosphere is to redistribute energy, generally from the equator to the pole. Horizontal banding is the key, distinguishing feature of our giant planets, with the Coriolis effect due to their rapid rotation splitting the equator-to-pole circulation into a series of zones and belts. Earth has three such circulation cells (Hadley Cell, Ferrell Cell and Polar Cell, with associated zonal winds like the trade wind easterlies and the mid-latitude westerlies), whereas the gas giants have many more and the picture on the ice giants is still unclear. On Jupiter and Saturn, the old paradigm was to have air rising in anticyclonic, cool and cloudy zones, and falling in cyclonic, warm and cloud-free belts. This pattern of rising and falling air is consistent with the observed temperature and cloud patterns. But today we know the picture to be more complex than this. Indeed, the cold and cloudy upper troposphere of anticyclonic regions may be a natural consequence of the vertical stratification of the atmosphere - the air must cool and expand above a high pressure region in order that it can fit beneath the rigid and stabilised tropopause, which resists bulging upwards over a high pressure anticyclone and resists bulging downwards over a low pressure cyclone. In this sense, the cloudiness and cold temperatures are natural features of the primary circulation (i.e., that related to the horizontal winds alone and the vertical shear related to stratification), without requiring the vertical motions. Of course, vertical motions may be later induced by these temperature anomalies as part of a secondary circulation, but they are not the driving force behind the cloudiness (Palotai, Dowling and Fletcher, 2014).
Coupled with this are recent observations by Galileo and Cassini: lightning strikes appear to occur primarily in the cyclonic belts (where we’d previously assumed downwelling), and eddy momentum flux convergence tends to pump the zonal jets, consistent with an overturning circulation precisely opposite to our canonical view. This opens the prospect of multiple stacked circulation cells, such that air actually rises in the lower part of a belt, but sinks in the upper part. The necessity for two cells on top of one another might be a consequence of the transition from a regime where small eddies pump the jets to a regime where the jets are being damped and the zonal winds decay with altitude. All this is tied to the condensation of clouds and the release of latent heat, but there is currently no convincing tropospheric meteorological model to explain all the observations. Furthermore, the vertical structure of the winds (i.e., how far they penetrate into the deeper troposphere or the stratosphere) is far from certain.
On a small scale, the same atmospheric circulation can be applied to our understanding of vortices. These rotating storms are common place, such as the cloudy and cold anticyclones of the giant planets (the Great Red Spot, Oval BA and Saturn’s storm-created vortices) and the dark ovals of the ice giants (like Neptune’s Great Dark Spot) and their associated bright orographic clouds (i.e., clouds forming over the regions of strong pressure gradients). Once again, the cold top halves of the vortices are explained as a natural consequence of having a high-pressure core beneath a rigid tropopause, and this thermal anomaly induces secondary circulation (central upwelling and peripheral downwelling). The different appearances of the vortices depend on their size and where the downwelling can occur - sometimes it can create a red ring within the anticyclone, sometimes a bright periphery, and in the case of the Great Red Spot it can also cause a warm sub-vortex (Fletcher et al., 2010). But this all suggests a warm core to the anticyclones at depth (maybe below the clouds) associated with the latent heat release of water condensation, which to date has never been observed. Our next steps must be to probe the thermal conditions below the clouds to understand the circulation of these vortices.
As an aside, the largest anticyclones are known to vary and change by subsuming smaller vortices and eddies. The Great Red Spot has been shrinking steadily in the east-west direction ever since records began, and recent observations by the Hubble Space Telescope (April 2014) have indicated that the spot is smaller, and more circular, than ever before. No one knows what the fate of the Great Red Spot may be, but it is certain that this shrinkage is currently accelerating.
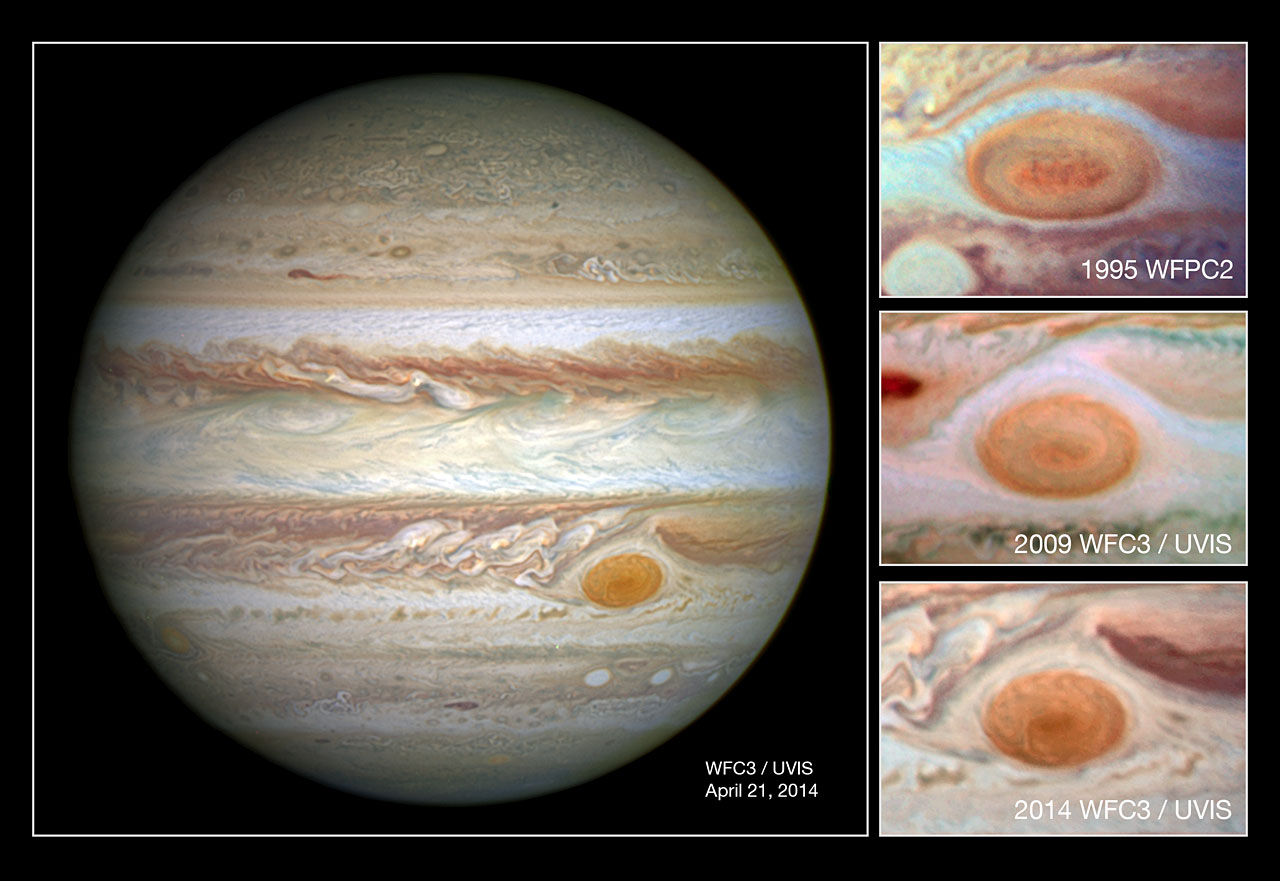 |
| Hubble observations of the shrinking Great Red Spot since 1995. |
Constantly Evolving Atmospheres
Despite the constant banded structure and the slow seasonal evolution, the atmospheres of the giants are continuously shifting and changing. The visibility of the churning troposphere varies from planet to planet due to obscuring hazes overlying the main cloud decks, but every so often a plume driven by the condensation of water will erupt through these cloud decks. These spectacular plumes dredge material from the deeper atmosphere which is then redistributed by the powerful zonal winds. Examples include the plumes that revived the faded South Equatorial Belt on Jupiter (punching through the haze that had formed to hide the typically brown belt beneath a white veil) and the storm plumes on Saturn in 2010-11 that produced dramatic effects on Saturn’s springtime hemisphere. Discrete convective events are also visible on the ice giants, although their nature and composition are unclear.
These strong tropospheric events can excite waves (gravity waves, Rossby waves, etc.) that propagate upwards into the more stable middle atmosphere. Indeed, maps of stratospheric temperature obtained from ground-based observatories show that Jupiter’s stratospheric appearance is dominated by these slowly-moving wave trains that shift from night to night and vary in amplitude. In the most extreme case, the transport of energy by these waves led to the emergence of an enormous anticyclone in Saturn’s stratosphere (nicknamed the ‘beacon’). This vortex, invisible in reflected sunlight due to its altitude hundreds of kilometres above the clouds, was short lived but larger, at its peak, than Jupiter’s famous Great Red Spot. We’re starting to appreciate just how important wave activity is to the middle atmospheric structure of the giant planets. Even in the troposphere, wave activity is commonplace - from the chevrons and hotspots seen in Jupiter’s equatorial region that may be manifestations of Rossby wave activity; meandering jet streams forming ribbon waves and hexagons on Saturn; and the equatorial scalloped wave recently revealed by Keck imaging of Uranus. The atmospheres of Jupiter and Saturn appear to be ‘marginally’ or ‘neutrally’ stable, which means that it doesn’t take much to excite instabilities, form eddies and wave phenomena.
Summary
It is perhaps unsurprising that the four giant planets of our solar system share such commonalities - banded atmospheric structures, convectively-active tropospheres spawning eddies, waves and large-scale vortices; stable middle atmospheres perturbed by wave activity; polar regions that are unique compared to the horizontal organisation of the tropical latitudes. But the small differences in how these processes differ from planet to planet reveal much about the background state of each atmosphere. This presentation has shown how cloud condensation, chemistry, zonal jet pumping, tropospheric overturning, vortices and waves can shape the climates of the four giant planets. We showed how the general properties of these worlds can be explained by the source materials imprinted by their formation and the vertical thermal structures. We also saw that exploration still reveals surprises, from the shrinking Great Red Spot, the possibility of a hexagonal wave on Neptune, and gigantic invisible stratospheric vortices on Saturn.
The next evolution of our understanding of the giant planets requires long-term, self consistent datasets over multiple years to track the atmospheric evolution. A broad wavelength range is required to connect the visible appearance at the cloud tops to the environmental conditions (temperatures, humidity, chemistry, winds) measured at longer wavelengths. Furthermore, in situ exploration of these worlds by entry probes (or buoyant weather stations - we can hope!) is needed to provide ground-truth for the remote sensing, and penetrate below the cloud tops.

